Compare petrol, diesel, and EV ownership cost from price, age, annual distance, energy cost, maintenance, tax, insurance, and projected depreciation.
Last updated
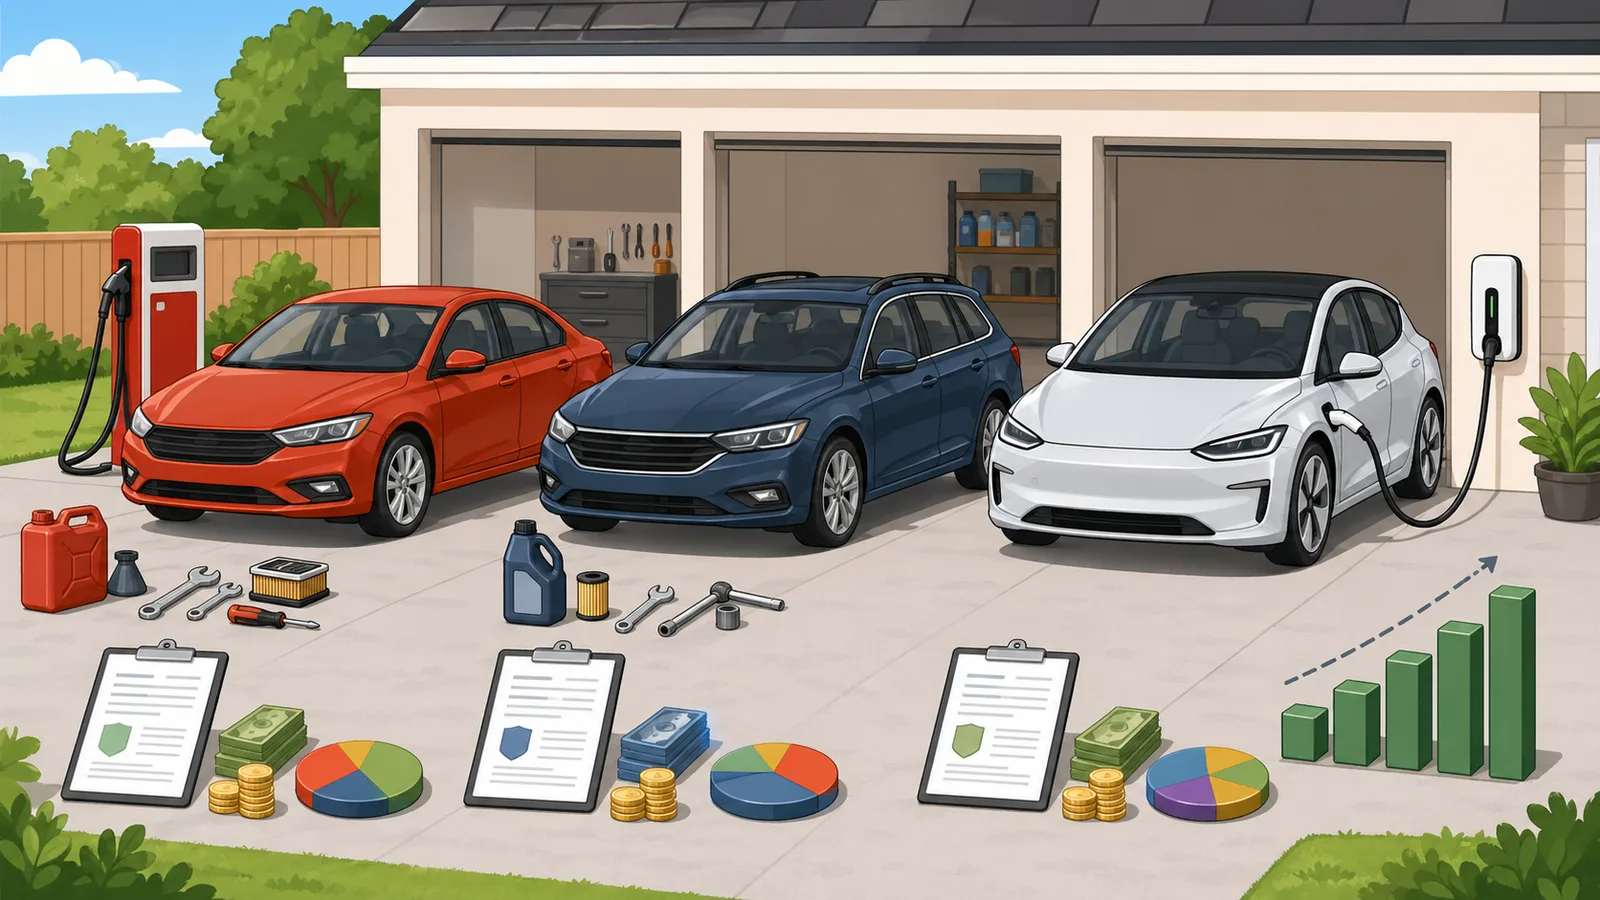
Car ownership cost calculator Compare the total cost of ownership for petrol, diesel, and EV vehicles in one worksheet.
This planner rolls together energy cost, tax, insurance, maintenance, other annual costs,
and age-aware depreciation so you can judge the real running cost before you buy.
Region, units, and currency
Changing region converts distance, efficiency, and fuel-price inputs between US,
UK, and metric conventions. Use it to turn this page into a petrol vs diesel vs EV
cost calculator for your own market.
Example comparison sets
Start with a realistic used-car mix, then edit the vehicle cards below.
Vehicle 1
Powertrain
Vehicle 2
Powertrain
Vehicle 3
Powertrain
Total cost of ownership leader
Battery EV
Battery EV is projected to cost $2,398.77 less than Gasoline crossover over 5 years.
Cheapest modeled ownership cost
$28,610.44
Gap to runner-up
$2,398.77
Annual distance
12,000 miles
Ownership horizon
5 years
Car running cost comparison sheet
Compare total cost, annual cost, energy spend, depreciation, and resale in one table.
Metric
Gasoline crossover
Diesel wagon
Battery EV
Powertrain
Gasoline
Diesel
EV
Modeled total cost
$31,009.21
$32,560.55
$28,610.44
Average annual cost
$6,201.84
$6,512.11
$5,722.09
Cost per mile
$0.52 / mile
$0.54 / mile
$0.48 / mile
Energy cost
$8,142.85
$6,833.35
$2,823.55
Maintenance cost
$4,112.50
$4,712.00
$2,310.00
Repair reserve
$2,187.50
$3,400.00
$1,254.00
Depreciation
$7,666.36
$8,365.20
$13,122.89
Projected resale value
$14,333.64
$15,634.80
$13,877.11
Gasoline crossover
$31,009.21
$516.82 per month on average with a projected resale
value of $14,333.64 at the end of the plan.
Depreciation$7,666.36
Energy$8,142.85
Maintenance$4,112.50
Repair reserve$2,187.50
Fixed costs$8,900.00
Diesel wagon
$32,560.55
$542.68 per month on average with a projected resale
value of $15,634.80 at the end of the plan.
Depreciation$8,365.20
Energy$6,833.35
Maintenance$4,712.00
Repair reserve$3,400.00
Fixed costs$9,250.00
Battery EV
$28,610.44
$476.84 per month on average with a projected resale
value of $13,877.11 at the end of the plan.
Depreciation$13,122.89
Energy$2,823.55
Maintenance$2,310.00
Repair reserve$1,254.00
Fixed costs$9,100.00
Decision timing and trade-offs
These callouts show when the current leader becomes cheaper overall and which cost buckets are doing most of the work.
Battery EV vs Gasoline crossover
Cheaper by year 4
Battery EV does not start in front, but it overtakes Gasoline crossover by year 4 and ends $2,398.77 cheaper overall.
Total gap
$2,398.77 lower
Average annual gap
$479.75 lower
Energy spend
$5,319.30 lower
Maintenance spend
$1,802.50 lower
Repair reserve
$933.50 lower
Depreciation
$5,456.53 higher
Insurance, tax, and other fixed costs
$200.00 higher
Battery EV vs Diesel wagon
Cheaper by year 3
Battery EV does not start in front, but it overtakes Diesel wagon by year 3 and ends $3,950.11 cheaper overall.
Total gap
$3,950.11 lower
Average annual gap
$790.02 lower
Energy spend
$4,009.80 lower
Maintenance spend
$2,402.00 lower
Repair reserve
$2,146.00 lower
Depreciation
$4,757.69 higher
Insurance, tax, and other fixed costs
$150.00 lower
Year-by-year cumulative cost table
Use this view to spot when depreciation tapers off, when the EV catches the diesel, or
when maintenance starts to dominate.
Year
Gasoline crossover
Diesel wagon
Battery EV
Year 1
$6,784.57Annual total $6,784.57 · resale $19,800.00
$7,358.27Annual total $7,358.27 · resale $21,360.00
$7,921.11Annual total $7,921.11 · resale $22,140.00
Year 2
$13,391.14Annual total $6,606.57 · resale $17,820.00
$13,845.74Annual total $6,487.47 · resale $19,651.20
$13,878.62Annual total $5,957.51 · resale $19,261.80
Year 3
$19,307.11Annual total $5,915.97 · resale $16,572.60
$20,256.91Annual total $6,411.17 · resale $18,079.10
$19,480.16Annual total $5,601.54 · resale $16,757.77
Year 4
$25,177.76Annual total $5,870.65 · resale $15,412.52
$26,602.71Annual total $6,345.80 · resale $16,632.77
$24,104.07Annual total $4,623.91 · resale $15,249.57
Year 5
$31,009.21Annual total $5,831.45 · resale $14,333.64
$32,560.55Annual total $5,957.84 · resale $15,634.80
$28,610.44Annual total $4,506.37 · resale $13,877.11
How the modeling works Depreciation is projected from today's entered price using age-sensitive powertrain curves,
while maintenance rises gradually as vehicles age. Fuel, electricity, insurance, tax, and
other annual costs are treated as today's-money estimates rather than inflation-adjusted
forecasts, so this is best used for side-by-side decision-making rather than a guaranteed
future budget.
Petrol vs diesel vs EV cost calculator: compare the true cost of ownership
A car ownership cost calculator is most useful when it compares the full total cost of ownership rather than only fuel or charging. This page also explains the main assumptions behind the petrol vs diesel vs ev cost calculator result, highlights the supporting figures shown by the calculator, and helps the reader use the estimate without overstating what a quick online tool can prove.
What this car ownership cost calculator is actually comparing
A full car running cost calculator should not stop at the pump or charging point. The yearly cash cost of owning a vehicle includes fuel or electricity, insurance, tax or registration, scheduled servicing, maintenance, repair reserves, tyres, and other recurring ownership costs such as parking permits or roadside cover. On top of that, there is depreciation, which is the value lost while you hold the vehicle. Depreciation is often the single biggest cost for a newer or more expensive vehicle, so leaving it out can make the wrong car look cheaper.
That is why this planner combines fixed annual costs and variable running costs with a forward depreciation model. You enter what the vehicle would cost to buy today, not its original list price, then the calculator projects likely value loss from the current age onward. That approach makes it useful for used-car decisions as well as new-car comparisons, because the economic question is usually what the next few years will cost from today rather than what the first owner already lost.
The result is a proper total cost of ownership comparison sheet. Instead of asking only whether an EV is cheaper than petrol at your current energy prices, or whether diesel saves fuel on a motorway commute, you can compare the whole ownership picture across all major cost buckets and see the cumulative difference year by year.
Annual ownership cost = Depreciation + Energy cost + Insurance + Tax/registration + Maintenance + Other annual costs
The calculator adds both cash running costs and modeled value loss so the result reflects total cost of ownership rather than a narrow fuel-only view.
Total cost of ownership = Sum of annual ownership costs over the planned holding period
The headline comparison uses the chosen ownership horizon rather than a single-month or single-trip result.
Projected resale value = Current price - Future modeled depreciation
Depreciation is projected forward from today's entered purchase price or market value using age-sensitive powertrain assumptions.
Why the repair reserve is separate from routine maintenance
Strong vehicle cost-of-ownership tools usually separate predictable maintenance from repair risk. Scheduled maintenance covers known service items such as oil changes, inspections, filters, brake fluid, tyres, and routine wear items. A repair reserve is different: it is a planning allowance for less predictable faults, diagnostic work, parts failures, and age-related fixes that may not happen every year but still belong in a realistic ownership budget.
This calculator keeps those buckets separate so a new or warrantied car can use a low repair reserve while an older diesel, high-mileage petrol car, or out-of-warranty EV can carry a more conservative allowance. The model then lets that repair reserve rise with age and distance, because the same annual reserve should not have the same impact on a two-year-old vehicle and a ten-year-old vehicle.
That split is especially useful when comparing petrol, diesel, and electric cars. EVs often have fewer routine service items, but battery, tyre, suspension, software, and specialist diagnostic risks can still matter. Diesels can look excellent on fuel economy while carrying higher repair exposure if emissions equipment, turbochargers, or high-pressure fuel-system repairs become likely. A total cost of ownership calculator is stronger when it lets those trade-offs show up explicitly instead of hiding them inside one generic maintenance number.
Why petrol vs diesel vs EV ownership cost can flip once depreciation is included
Many public tools work like an EV vs petrol cost calculator but only compare energy cost per mile. That is useful for a narrow running-cost question, yet it can be misleading for a real purchase decision. A used diesel may have the lowest fuel bill on long-distance driving, while a used EV may still win on maintenance and tax, and a cheaper petrol car may remain the most economical overall if its lower buy price offsets higher energy spend.
The missing piece is usually depreciation. A vehicle that is cheaper to run each month can still be more expensive to own overall if it loses more value over the time you plan to keep it. The opposite can also happen: a vehicle with higher pump or charging cost can still come out ahead if it is already deep into the depreciation curve and expected resale remains relatively stable. That is why this calculator treats depreciation as a first-class input rather than a footnote.
Age matters here. The first years of ownership usually carry steeper value loss, while later years are more about fuel, charging, maintenance, and reliability. This page therefore uses current age when projecting future ownership cost. It is trying to answer a practical planning question: from today forward, which vehicle is likely to cost least to keep on the road?
Further reading
AAA — New vehicle costs drop to $11,577 — AAA overview of the major cost buckets drivers face beyond fuel alone, including depreciation, maintenance, insurance, finance, and tyres.
EPA — Fuel Economy — Official US fuel-economy resource covering MPG, fuel cost, and the habits and conditions that change real-world energy use.
How country and unit settings change the calculator
A true car total cost calculator has to respect the way drivers in different countries think about vehicle efficiency. In the United States, petrol and diesel drivers usually think in MPG and fuel price per gallon. In the United Kingdom, MPG is still common but fuel is sold per litre. In many other markets, drivers plan in kilometres and litres per 100 kilometres, while EV drivers often use either miles per kWh or kWh per 100 km depending on the country.
This page uses the region selector to switch labels and units so the inputs match what local drivers are likely to know from dashboards, pump prices, or EV trip computers. When you change between US, UK, and metric modes, the calculator converts annual distance, fuel economy, and fuel price inputs so you do not have to rebuild the comparison from scratch. That matters because a petrol vs diesel vs EV cost calculator becomes much less useful if it silently reinterprets numbers when the unit system changes.
Country selection does not inject tax law or incentive rules. Instead, it adjusts the planning interface so the maths reads naturally in the units and currency you expect. Annual tax, insurance, and maintenance remain user-entered because those costs vary too much by car, postcode, and ownership profile to guess reliably from country alone.
What usually flips the winner: mileage, charging mix, and finance assumptions
Many readers want a simple answer such as whether an EV is cheaper than petrol or whether diesel is still worth it for motorway use. In practice, the winner usually changes because of four levers: annual mileage, current buy price, expected depreciation, and how the vehicle is actually fueled or charged. High-mileage driving usually strengthens diesel or EV economics because the energy-cost difference compounds faster. Lower mileage often makes the purchase-price and depreciation gap more important than the pump or charger bill.
Charging assumptions matter more than many quick calculators admit. A battery EV that is mostly charged at home on a favorable tariff can build a large running-cost advantage, but an EV that relies heavily on public rapid charging may give back much of that saving. This page therefore works best when you enter an electricity price that reflects your likely real charging pattern rather than the cheapest tariff you can find online.
Repair assumptions can also move the result. If one vehicle is still under a strong warranty and another is older, higher mileage, or known for expensive parts, give them different repair reserves instead of forcing both into the same maintenance estimate. This is one of the places where a custom car ownership cost calculator can beat generic averages: it lets your specific shortlist carry its own risk profile.
Financing, sales tax, dealer fees, and home-charger installation can also change the result, especially if the vehicles being compared are far apart in purchase price. Those costs are not auto-filled here because they depend too heavily on your exact deal and location. If they are material, fold them into today's buy price or compare them separately with the related car finance tools so the ownership decision is not built on an artificially narrow total cost of ownership estimate.
Worked example: a used petrol hatch, diesel estate, and EV crossover
Suppose you are deciding between three used cars and expect to drive about 10,000 miles per year for the next four years. The petrol car costs less to buy and has moderate servicing costs. The diesel promises better motorway economy but higher maintenance and tax. The EV costs more upfront but has lower energy cost and lower routine maintenance. If you compare fuel or charging alone, the EV and diesel may both look much cheaper than petrol.
Once depreciation and resale are added, the answer can change. The petrol car may remain competitive because its lower buy price limits the cash tied up in the asset, while the EV may still win if the electricity cost and maintenance savings outweigh the larger depreciation hit. The diesel can land anywhere in the middle depending on price, age, and annual mileage. That is why the year-by-year table matters: it shows not only which vehicle is cheapest overall, but when the lead changes and which cost bucket is driving the result.
Use the preset examples as starting points, then replace them with the exact cars you are considering. The stronger your inputs on current buy price, fuel or charging cost, and likely maintenance, the more realistic the comparison becomes.
Frequently asked questions
What is included in total cost of ownership for a car?
This calculator includes projected depreciation, fuel or electricity cost, insurance, tax or registration, service and maintenance, and any other annual ownership costs you add. It does not model financing interest directly, so if borrowing cost matters you should compare that separately with an auto-loan or lease calculator.
Why can an EV still be expensive to own if charging is cheap?
Cheap charging only answers the running-cost part of the question. An EV can still have a higher total cost of ownership if the buy price is much higher or if depreciation is steeper over your planned holding period. The comparison only becomes realistic once those factors are included alongside electricity cost.
When is diesel cheaper to own than petrol?
Diesel is most likely to win when annual mileage is high, motorway efficiency is much better than the petrol alternative, and the higher purchase price, maintenance cost, or tax burden are not large enough to erase the fuel savings. On lower mileage, the running-cost advantage often shrinks.
Does this calculator use live depreciation data?
No. It uses an age-aware planning model rather than live market listings, VIN-specific trade-in data, or dealer bids. The goal is to compare likely ownership paths from today, not to produce an exact resale offer.
Should I enter the original list price or today's buy price?
Enter the price you would pay for the vehicle today, or its current market value if you already own it. The calculator projects costs forward from that point, which makes it much more useful for used-car decisions.
Can I use this as an EV vs petrol cost calculator only?
Yes. If you only want to compare two vehicles, leave one card unticked and compare any two setups you like. The page is broader than a basic EV vs petrol cost calculator because it can also include diesel and can rank all included vehicles by total cost of ownership.
What usually changes the EV break-even point most?
The biggest levers are annual mileage, the upfront price gap, expected depreciation, and whether charging is mostly done at home or on public rapid chargers. Higher mileage and cheaper home charging tend to move the break-even point in the EV's favor, while low mileage, expensive electricity, or a large purchase-price premium can delay or eliminate the EV advantage over the years you plan to keep the car.
How should I handle loan interest, taxes, dealer fees, or charger installation?
If those costs are material to your decision, treat them as part of today's real acquisition cost rather than ignoring them. You can fold one-off purchase costs into the entered buy price, use the annual-cost fields for recurring ownership costs, and compare financing or charger setup separately with the related auto-loan, lease-versus-buy, or EV charging tools. The goal is to make sure your car total cost of ownership estimate reflects the actual deal you would face, not just the headline sticker price.
What should I enter for annual repair reserve?
Use the repair reserve for unpredictable repair risk rather than scheduled servicing. For a newer vehicle under warranty, the reserve may be small. For an older, high-mileage, imported, luxury, diesel, or out-of-warranty vehicle, use a higher allowance that reflects the repairs you would realistically need to budget for over the ownership period. Keep routine servicing in the maintenance field so the comparison can show whether predictable upkeep or repair risk is driving the total cost.